Even in the data center, it has been challenging to balance the cost of VDI and user experience. On the cost axis you need to figure out how many servers you need, how much storage you need, etc. If you have two few servers, and there are too many users on the same server then the user experience suffers. If you have too many servers then user experience may be fine, but you are spending too much money. It’s a balancing act between buying just enough servers and delivering the best user experience possible.
In delivering VDI in the cloud there are additional dimensions that becomes interesting. And it’s driven by on-demand pricing. Whereas on-premises, you buy the servers and storage up-front, and your costs are fixed whether you use the systems for one minute or 24 hours a day. In the cloud you have the option of paying for what you use, but this comes with additional complexity. If none of the machines are available when a user logs in, they must spend time waiting for a machine to be powered up. If there are too many machines that are powered up and running when the user shows up, then you’re paying more money than you should. For this article, we are not going to talk about capacity issues with on-demand provisioning, but that is an ongoing concern in the cloud.
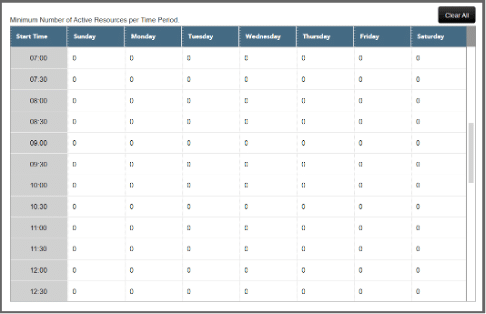
A warm-up policy is used to specify when machines are brought up and when machines are de-allocated. In Workspot, the warm-up policy allows IT to specify capacity requirements for each pool in 30-minute segments for all 7 days of the week.

But how do you know the warm up policy is working? In order to understand the effectiveness of the warm-up policy, you need the following pieces of information:
- In-use capacity
- Excess capacity that’s been allocated as a result of the warm-up policies
- End user login times
- Actual usage heatmap
In a perfect world, excess capacity would be 0% and user login times <30 seconds, which would mean that your costs and your user experience is balanced.
In Workspot Trends, our historical DEX product, we show all this data.
First, there is the historical usage vs. excess data. For e.g., for this pool, you will notice that most of the use is during the week, but there is a lot of excess capacity. Since these are expensive GPU workstation machines, this pool is consuming 30-40% more infrastructure than it needs.

Next, let’s compare that to the user login time data. The user login time is good during the work week as you would expect. But during the weekends it spikes up to 300-400 seconds. Are their users using their workstations during the weekend?

The heatmap can help answer that question. The heat map shows the actual usage for the pool in a similar 7-day table for every 30 minutes. As you can see there are a handful of users who are using their workstations on the weekend. The warm up policy has no allocation for weekend capacity and that accounts for the spike in login times.

For this customer, for this pool, they need to examine two actions:
- Are you comfortable with the additional excess capacity over the work week?
- Would you like to add some weekend capacity to reduce login times for users on the weekend?


