Workspot’s raison-d’être is to improve the lives of everyone involved in the “virtual desktops” food chain, whether it’s the CIO, the CISO, the hands-on IT staff, IT leadership or the end-users using virtual desktops, apps, and workstations. Among the many innovations, Workspot has introduced to the VDI and Desktop as a Service (DaaS) industry over the last few years is our cloud-based monitoring capabilities.
Top 3 Support Calls
The following are the top 3 issues that generate most help desk calls, based on our interactions with thousands of VDI customers over the last decade:
- User is not able to connect to the virtual desktop
- Desktop login takes a long time
- User complains that the performance is not good for desktop applications
Too Many Moving Parts in Legacy VDI
So what happens when the help desk phone rings and a user reports one of these issues? A legacy VDI solution has tens of components to the solution: servers, storage, networking, databases, hypervisor, provisioning servers, brokers, portals, load balancers, VPNs, end points, and thin clients. Our experience has been that no tool provides a good, holistic view of the end user problem. So every support call becomes a multi-faceted hunt for the truth; networking, storage, hypervisor, desktop, broker and server teams all need to collaboratively debug problems. And often the problems are in the white spaces between these teams where there is even less useful forensic data to be found.
Troubleshooting Skills Can Be Learned
As customers move to cloud solutions, all the infrastructure becomes invisible. There are no hypervisors, SANs, hyper-converged nodes, switches or firewalls. The elegance of cloud software is automation and moving up the stack! In the cloud, the infrastructure is completely abstracted away from the customers, and not only are there fewer operational issues and therefore fewer support calls, but now, (with the right tools), help desk personnel can handle the calls they do get themselves. There’s no more need for valuable and expensive IT personnel to spend their time troubleshooting support calls.
How is it different? There are fewer moving parts in a DaaS solution. DaaS vendor is responsible for the infrastructure and management components. The Workspot solution holistically captures all the data required to fix incoming support calls. Our monitoring features are both comprehensive and less noisy, which means it’s a huge improvement over other solutions. Let’s look at some of the Workspot features that address the problems highlighted above and make troubleshooting a problem much easier than ever before.
![]()
Comprehensive Events Feed
One of the reasons customers are surprised by our monitoring dashboard is that for years they’ve been dealing with an incomplete view of the end user’s interaction with the VDI product. Workspot Client runs on the user’s device; it’s heavily instrumented and captures all relevant interactions when the user launches it on her device.
For example, let’s consider the following common issue: The user calls and reports that she is not able to connect to her virtual desktop. Here are the steps the help desk staff can use to troubleshoot the issue:
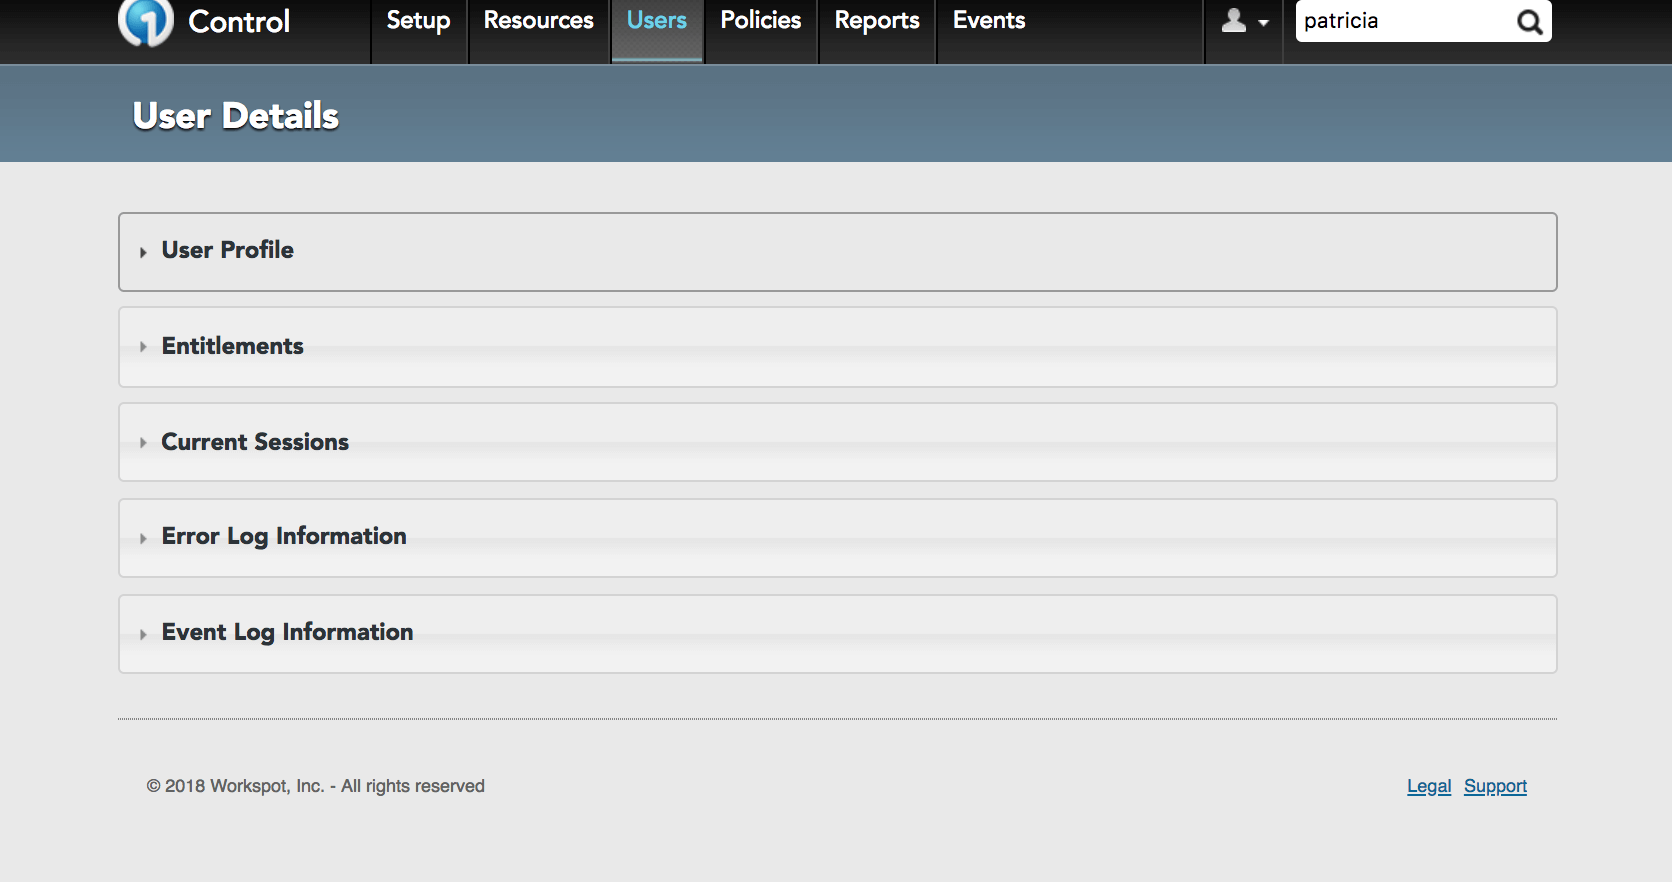
1. Find the user profile: Use the search box to find the user
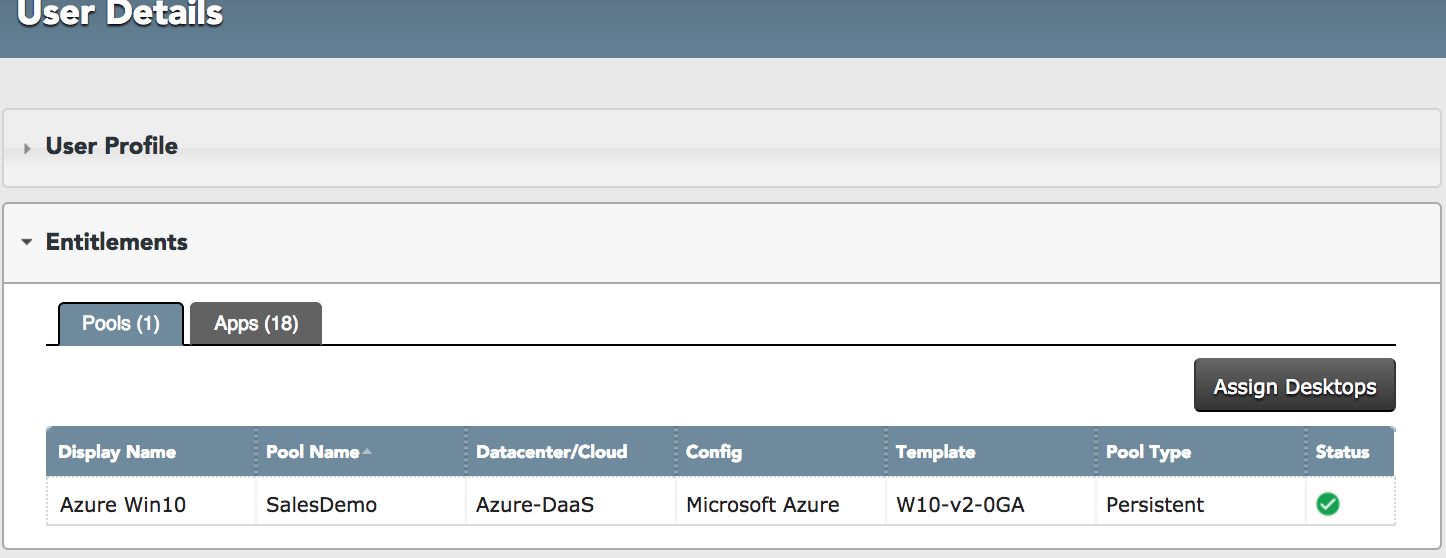
2. Check if the user has an active desktop or app entitlement
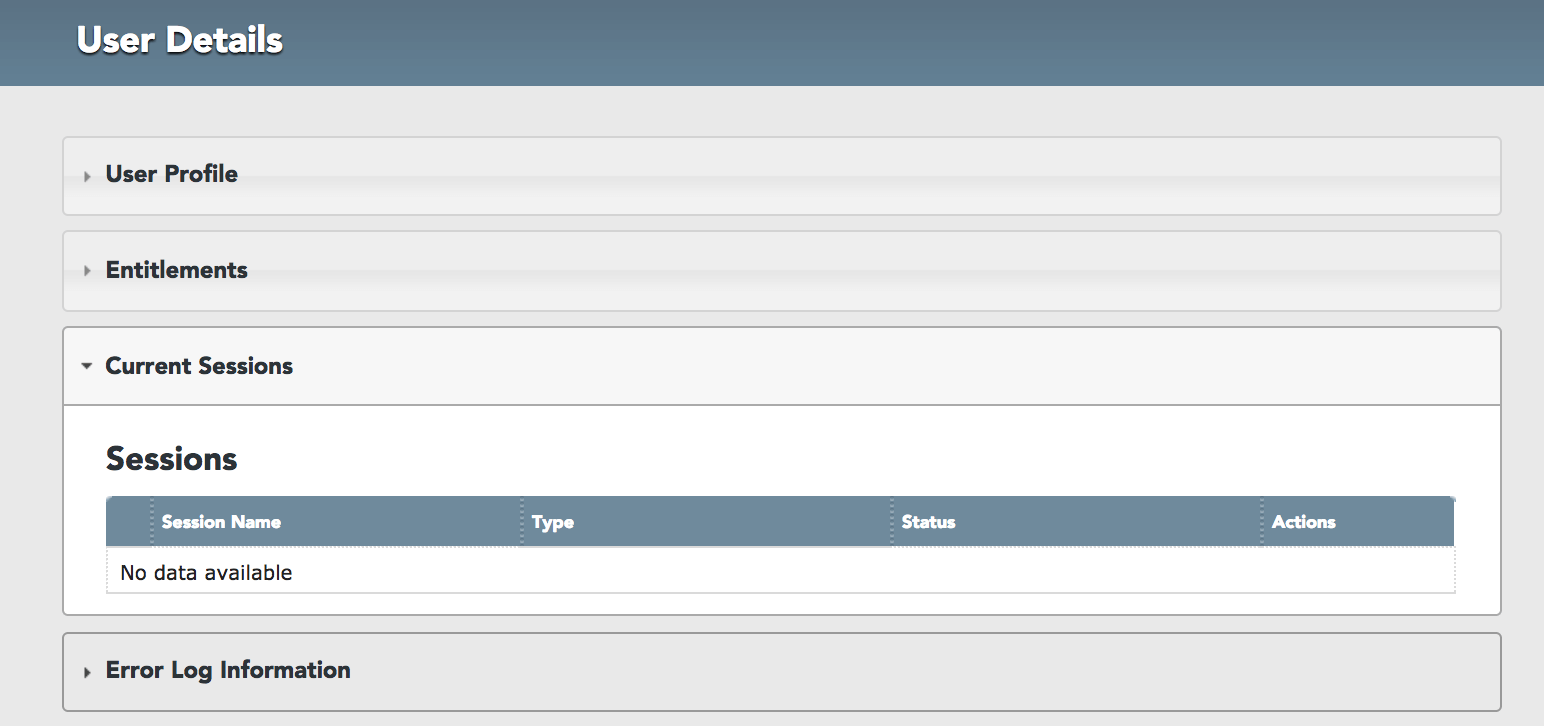
3. Check if the user has an active session
4. Look up event information to see if the user unlocked the client application and tried to connect to the application.
Notice that in this example, we simulated a problem with the gateway. The error shown below shows code: 50331670. We provide our customers with a rich list of error codes and support collateral to deal with the most common software and infrastructure issues. The error code suggests that “It’s an issue related to RD Gateway”. The actual error message shown to the end user is also captured in the event feed.

The steps above a) confirm that the end user has a valid problem and b) quickly helps the support person to get to the root cause.
The actual reason why the user is not able to connect could vary based on the client device, network connectivity, network topology of the DaaS deployment, DMZ setup with the RD Gateway, or anything related to authentication. The event feed captures the relevant information like “the user activated the client”, “the user opened or clicked on an application icon”, “the user got an error”, etc.
The causality of events is integral to the troubleshooting process.
The richness and quality of events for all the users across thousands of tenants running on the same cloud service is only possible because of Workspot’s unique cloud architecture.
It takes just 1-click in Workspot to get to the user profile, with all the details required for troubleshooting presented in a single view.
Performance Monitoring
When the user calls and complains about performance, the most important factor is to check the network conditions. If the user is connecting from a bad network with high latency and low bandwidth, the sluggish performance issues are well understood. In the user dashboard, Workspot displays the most important performance metrics, and high latency or jitter is typically the #1 culprit for lag seen by the user. High load on the desktop or RD Host can also cause common application performance issues.
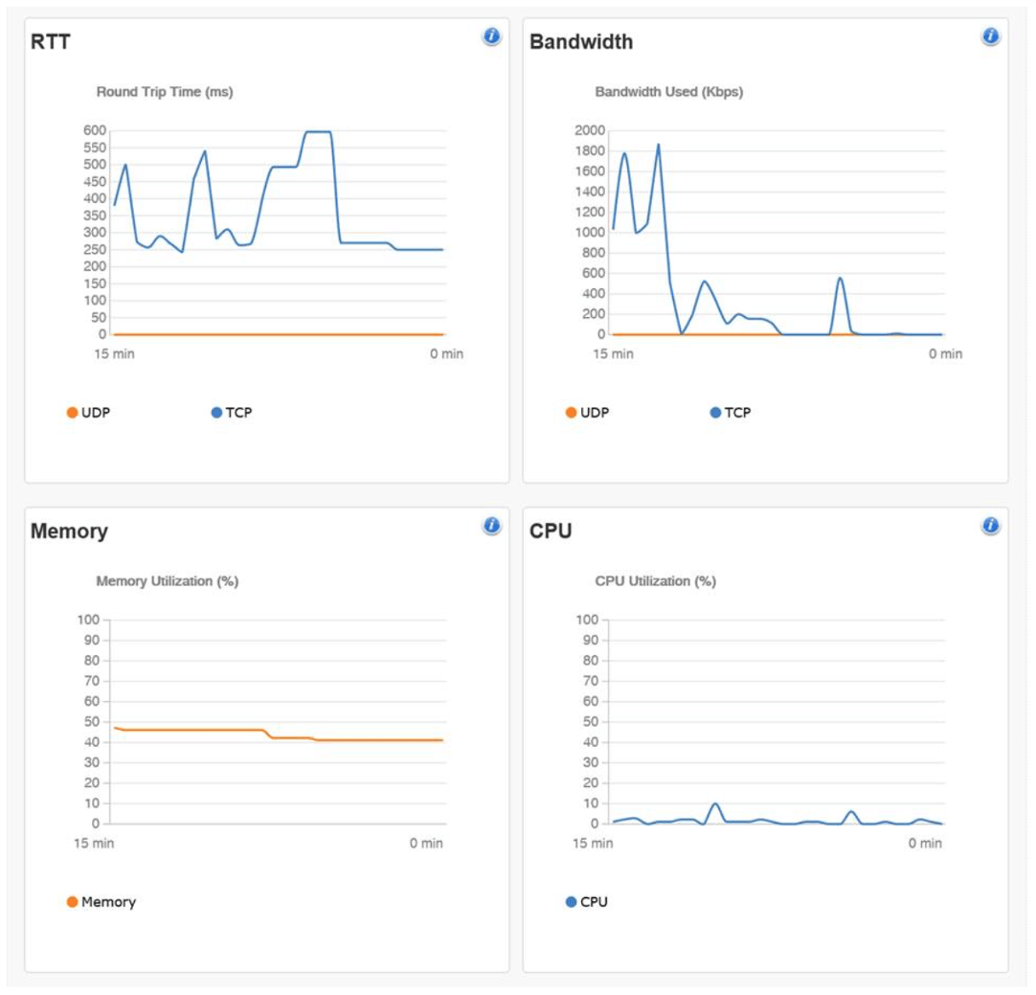
User session view displays latency, bandwidth, memory & CPU usage
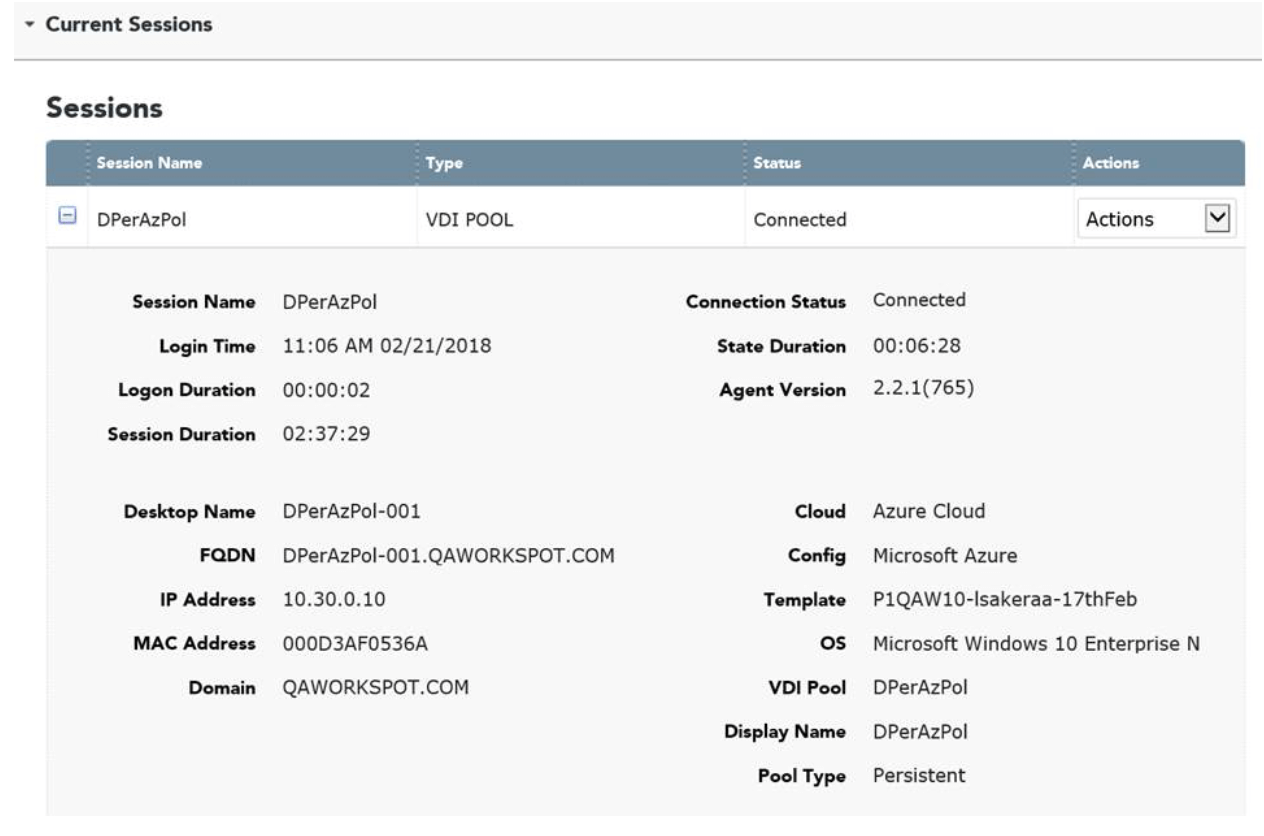
A detailed view of the user, shown below, includes logon speed, session duration, current session state duration, session state, client device, and more are also captured and presented on the same page. The drill-down of logon duration along with the snapshot of granular performance data captures all the relevant information IT needs on a single page.
Vroom! Remote Assist or End the User Session
The ability to start a remote assistance session (one-click Microsoft Remote Assist) or reboot the user desktop is also a time tested trick in the arsenal. Inline support and the ability to send messages directly to the user inside the virtual desktop further simplifies the round trips involved in closing the ticket.
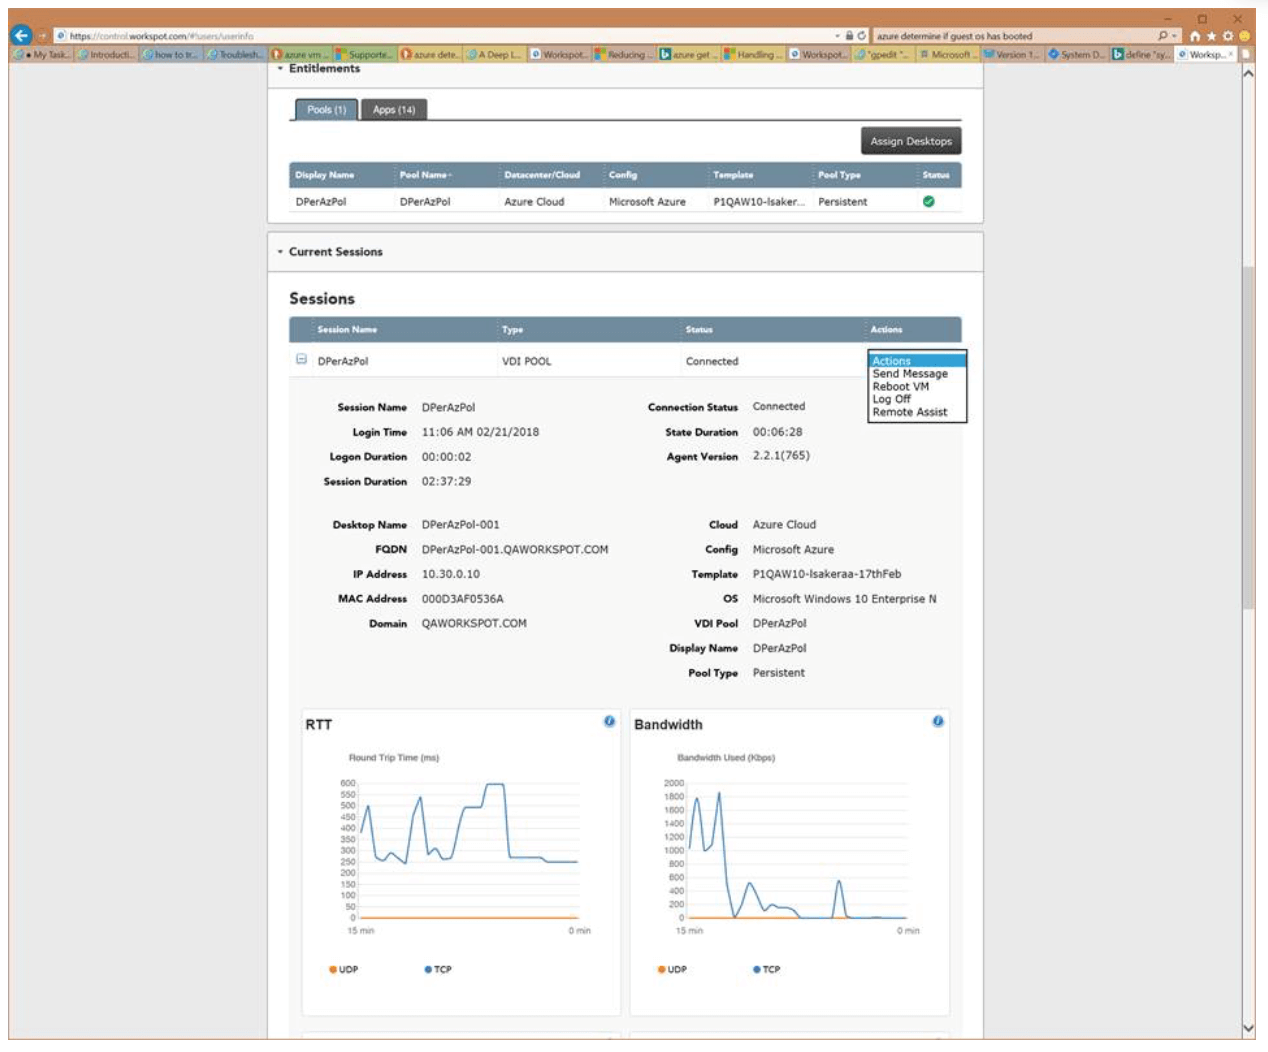
As shown above, Workspot provides a user-focused monitoring and troubleshooting console without any confusing product SKUs. All customers get the same features with simple pricing. The data is also aggregated and presented across pools, user-groups, and geographies for summary reports.
What would be really cool is to be able to ask: “How does the average login time across all the users in ACME corp look compared to all the other customers managed by Workspot on Azure?” With anonymized and opt-in global comparisons, customers can leverage the power of cloud-based data insights. Imagine the key performance questions that you’d like to ask other DaaS customers and have them answered in the Workspot dashboard right away. We are excited to announce that we will be shipping global comparison features in Q2, 2018!
There’s no doubt that the future of VDI is cloud-delivered. Fewer moving parts and a cloud-native architecture will deliver better reliability, security, and scalability, and our holistic monitoring solution enables you to quickly debug any issues your end users may have.
Cloud PCs


