VDI is a complex solution involving device endpoints, networks, gateways, servers, desktops, agents, operating systems, drivers, applications, browsers and other components. All these components are constantly being updated by the user (for e.g., their device or network), by IT, or by the ISV.
These constantly changing components can affect the user experience resulting in problems like an end user not being able to connect, application crashes, or an application slowing down or an application consuming more resources than before, etc.
The overall goal of Workspot DEX tools is to reduce MTTR (Mean Time To Resolution).

Workspot Watch is a real-time DEX tool that detects problems in real-time and helps IT perform root cause analysis in an integrated fashion across all the components of a VDI solution.
Workspot Trends is a historical DEX tool that captures various metrics for a year and enables IT to analyze trends over a period of time to detect and resolve emerging issues.
One of the most critical workflows we built into Workspot Trends was understanding good and poor sentiment of users – why is one user happy, and another not. This question is even more interesting when the users belong to the same group. Oscar and Jason belong to the same group but have very different sentiments. Oscar is happy, while Jason is not with his virtual desktop.

In Workspot Trends, you can quickly compare desktop metrics for the two users.
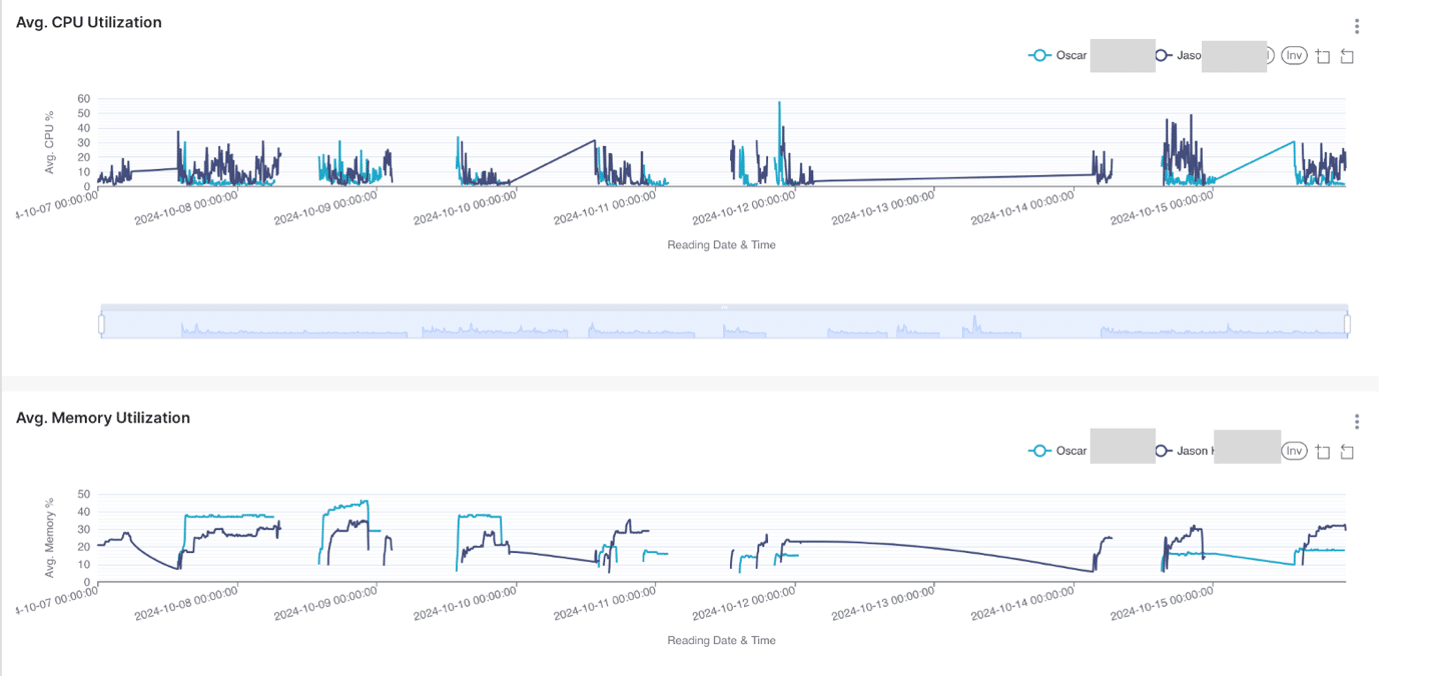
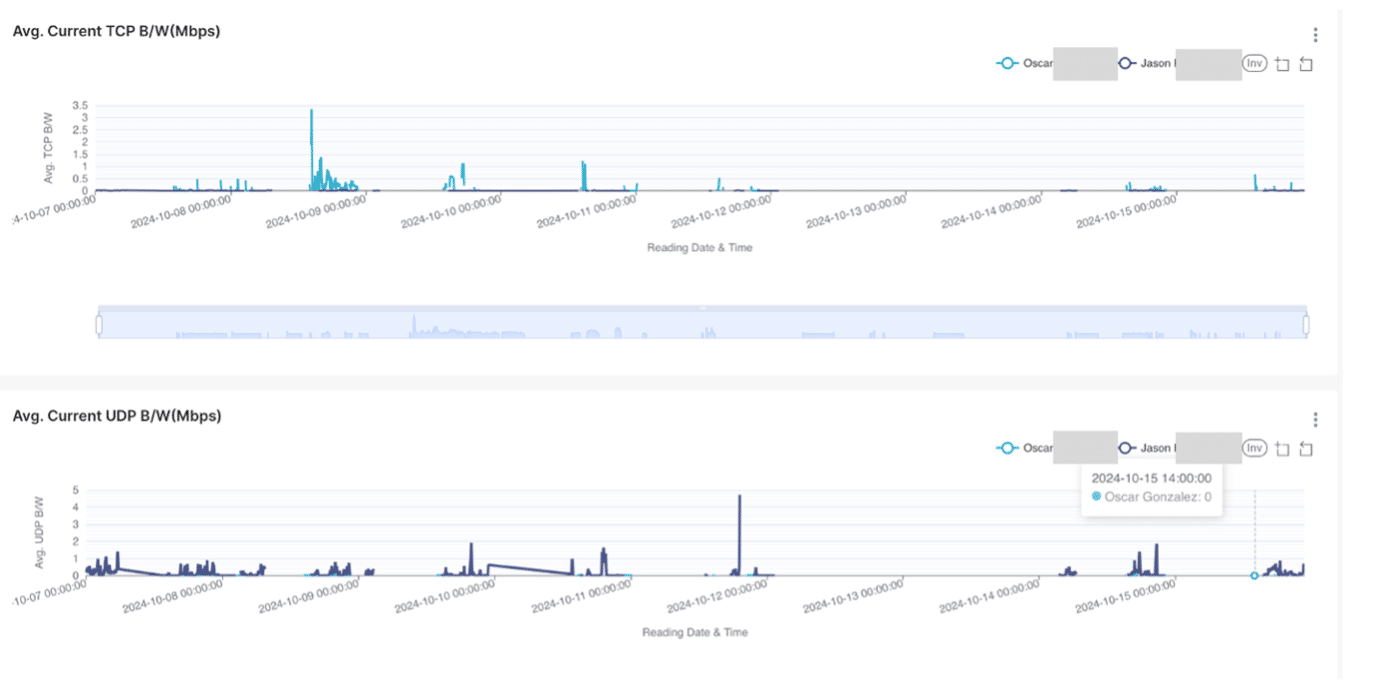
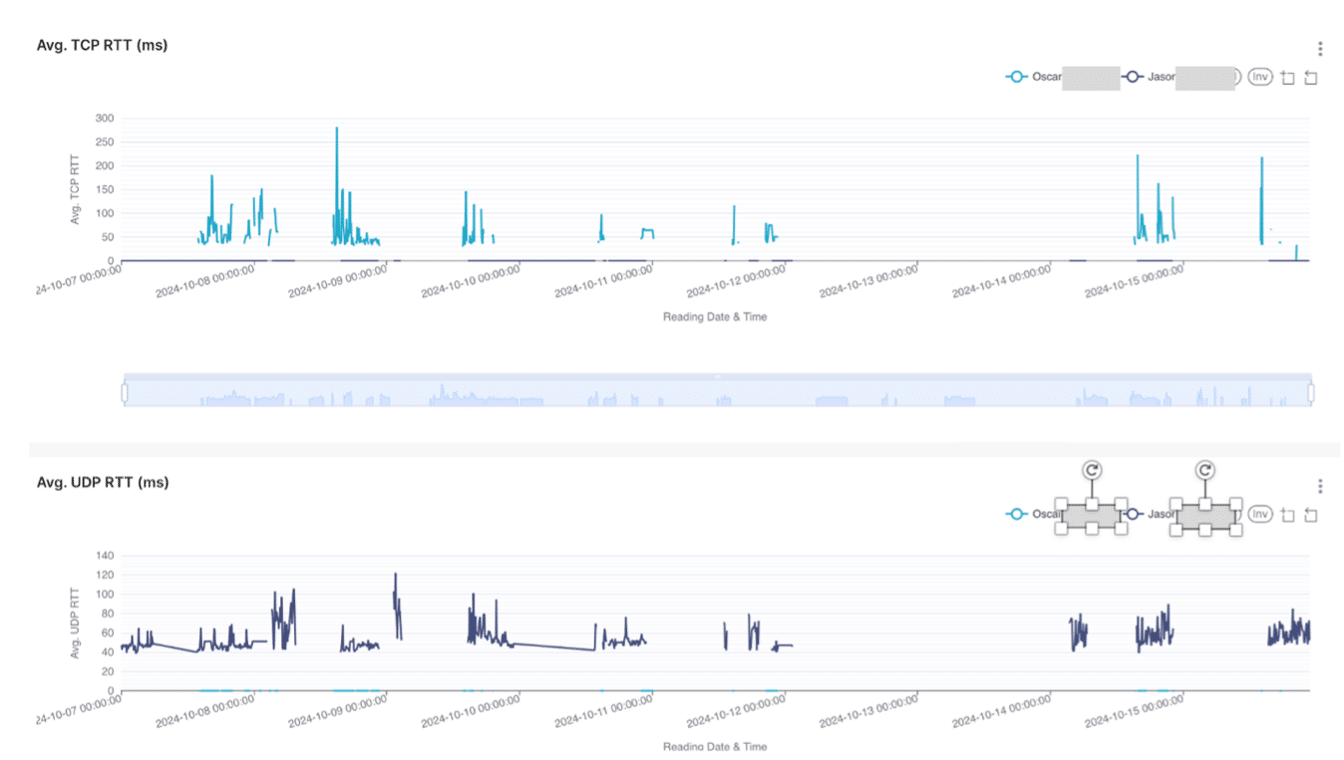
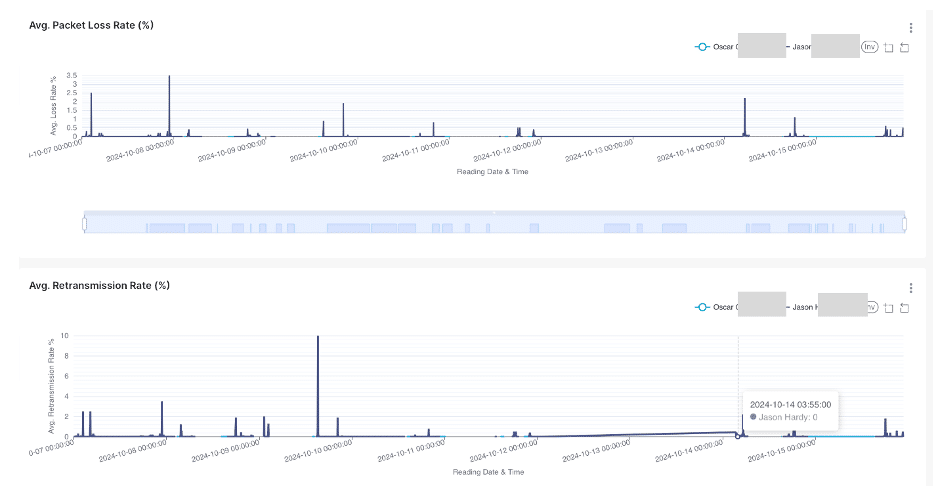
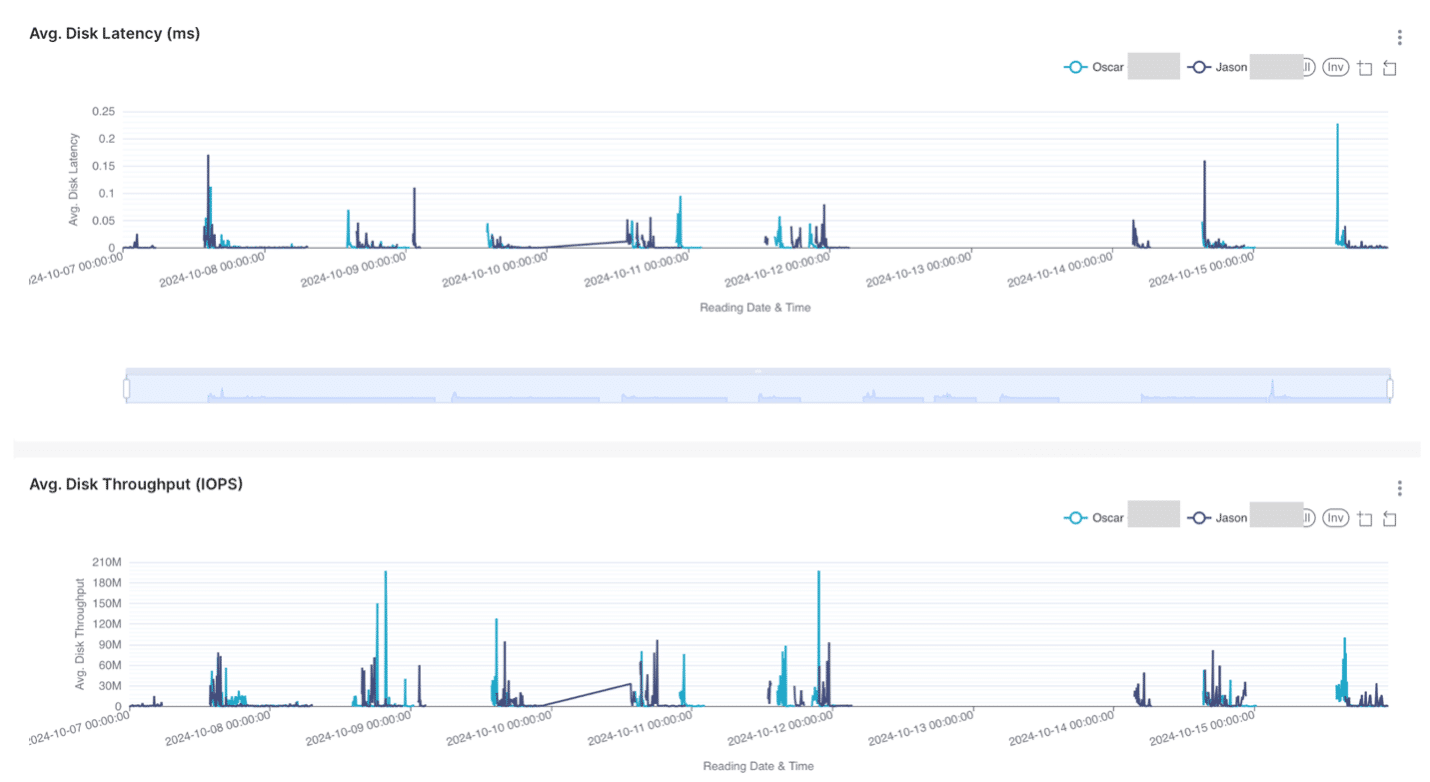
The one noticeable difference is Jason is on a more lossy network. Is this what is causing his poor user experience?


